Estimate density of attendees using social media data in city events
For more detail, please refer to the Link.
City-scale events attract large amounts of attendees in temporarily re-purposed urban environments. In this setting, the real-time measurement of the density of attendees stationing in – or moving through – the event terrain is central to applications such as crowd management, emergency support, and quality of service evaluation. Sensing or communication infrastructures (e.g. sensor networks, mobile phones) can be deployed to estimate the number of attendees currently occupying an area. However, the adoption of these technologies is hindered by their cost or sensing resolution. There is evidence that social media data can provide a real-time and semantically rich insight into attendees’ behaviour during city-scale events. Their suitability as a data source for attendees density estimation is yet to be investigated.
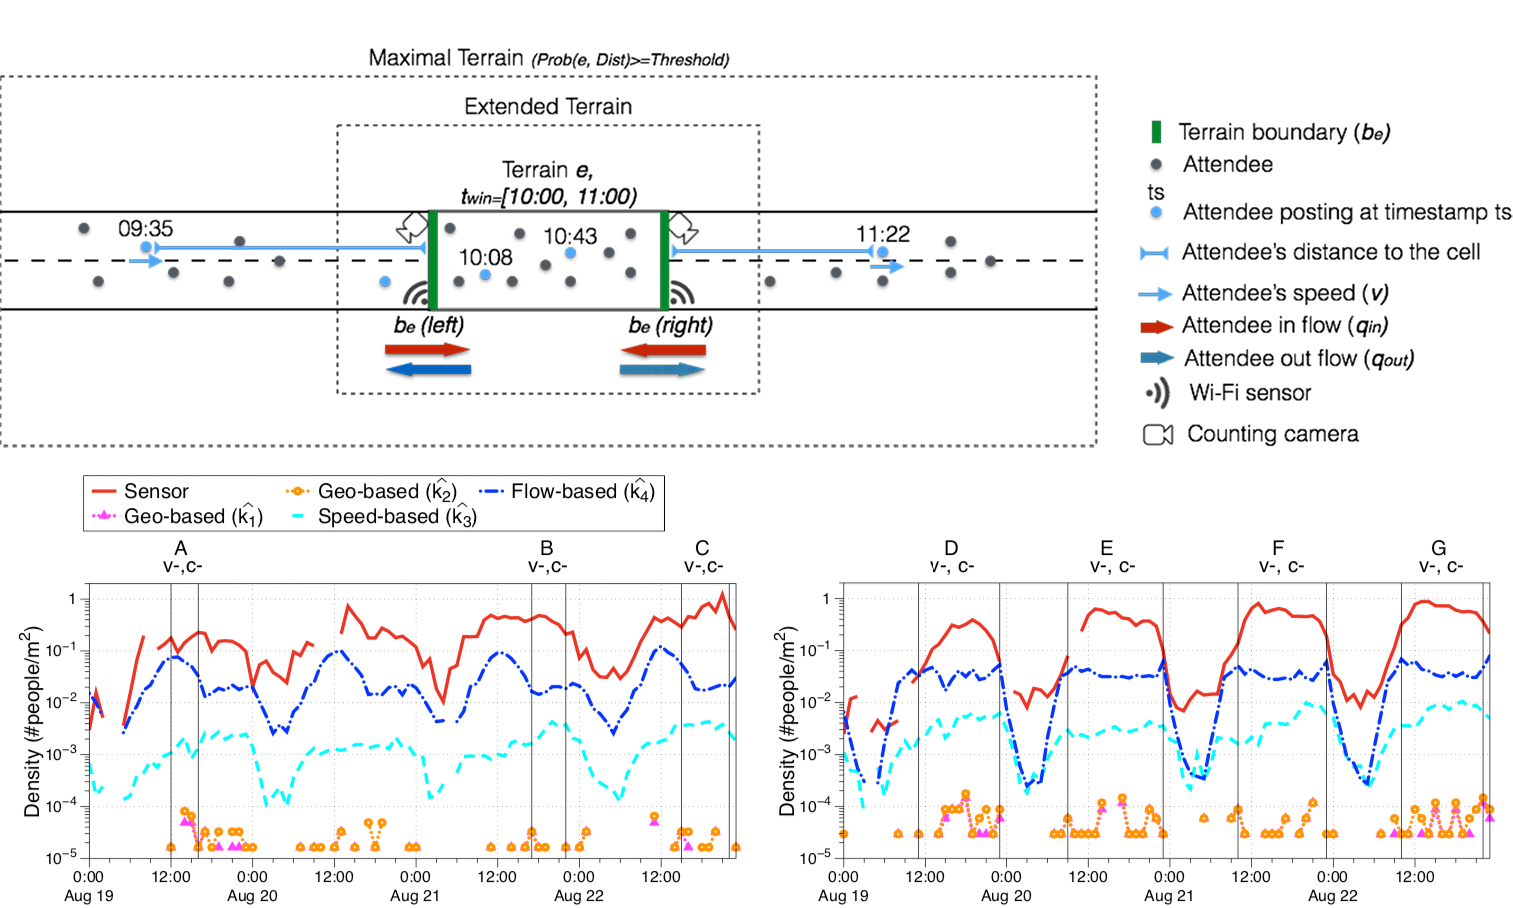
With this paper we aim at filling this knowledge gap by studying how micro-posts harvested from social media can be used during city-scale events to estimate the density of attendees in a given terrain.To cope with issues of temporal and spatial resolution, we propose 3 classes of density estimation strategies (i.e. geo-based, speed-based and flow-based), inspired by elements of pedestrian traffic flow theory that were successfully assessed during city-scale events. We study the performance of these strategies in the context of SAIL Amsterdam 2015 (Sail) and Kingsday Amsterdam 2016 (Kingsday), two city-scale events that attracted 2 and 1.5 million of attendees in the span of 5 days and 1 day, respectively. We defined four experimental terrains for the Sail event and one for the Kingsday event, and compare density estimates from social media data with measures obtained from counting systems and Wi-Fi sensors. Results show the potential of solutions embedding elements from pedestrian traffic flow theory, which yielded estimates with strong temporal correlations with the sensor observation, and limited mean errors.
The approach of this research is illustrated in the following figure.